This SFE was busier than SFE 2016, in that the Innovation Desk forecast a 15% probability of any severe hazard every day during the experiment - and a 15% verified according to the practically perfect forecasts based on preliminary LSRs. This was despite having a relatively slow final week. Slower weeks typically occur at some point during the experiment, and enhance the operational nature of the experiment. After all, SPC forecasters are working 365 days a year, whatever the weather may be! The Innovation Desk also issued one of their best Day 1 forecasts of the experiment during the final week, successfully creating a gapped 15%. If you read the "Mind the Gap" post, you know the challenges that go into a forecast like this:

This forecast was a giant improvement to the previously-issued Day 2 forecast, which had the axis of convection much too far north:

As for other takeaways from the experiment, the NEWS-e activity introduced an innovative tool for the forecasters, and will likely continue to play a role in future SFEs. Leveraging convection-allowing models at time scales from hours (i.e., NEWS-e, the developmental HRRR) to days (i.e., the CLUE, FVGFS) allows forecasters to understand the current capabilities of those models. Similarly, researchers can see how the models are performing under severe convective conditions and target areas for improvement. A good example of this came from comparing different versions of the FVGFS - two different versions were run with different microphysics schemes, and produced different-looking convective cores. Analyzing the subjective and objective scores post-experiment will allow the developers to improve the forecasts. For anyone interested in keeping up with some of these models, a post-experiment model comparison website has been set up. Under the Deterministic Runs tab, you can look at output for the FVGFS, UK Met Office model, the 3 km NSSL-WRF, and the 3 km NAM from June 5th onward.
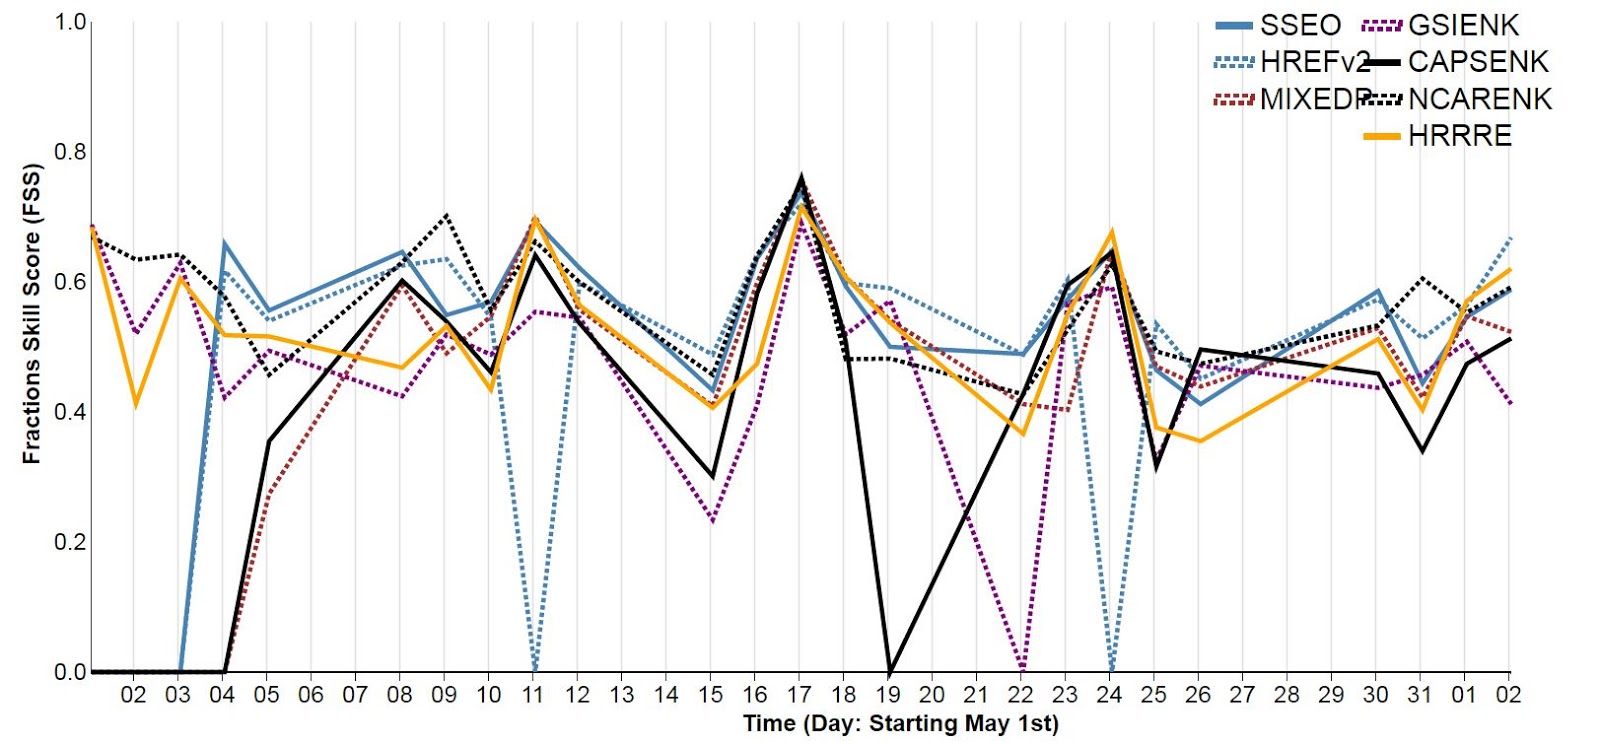
Much analysis remains to be done on the subjective and objective data generated during the experiment. Preliminary Fractions Skill Scores (FSSs) for each day:
and aggregated across the days for each hour:

give a preliminary metric of each ensembles' performance. The FSS looks at the number of gridboxes covered by a phenomenon (in this case, reflectivity) within a certain radius in the forecast and the observations, therefore eliminating the problem of double penalization incurred when a phenomenon is slightly displaced between the forecasts and the observations. The closer the score is to one, the better it is. Now, there are some data drop-outs in this preliminary data, but it still looks as though the SSEO is performing better than most other ensembles. Aggregated scores across the experiment place the SSEO first, with an FSS of .593. The HREFv2, which is essentially an operationalized SSEO with some differences in the members, was second, with an FSS of .592. Other high-performing ensembles include the NCAR ensemble (.580) and the HRRR ensemble (.559). Again, this data is preliminary, and these numbers will likely change as the cases that didn't run on time in the experiment is rerun.
As for what SFE 2018 will hold, discussions are already underway. Expect to see more of the CLUE, FVGFS, and NEWS-e. A switch-up in how the subjective evaluations are done and revamp of the website is also in the pipeline. Even as the data from SFE 2017 begins to be analyzed, we look forward to SFE 2018 and how we can continue to improve the experiment. Ever onward!