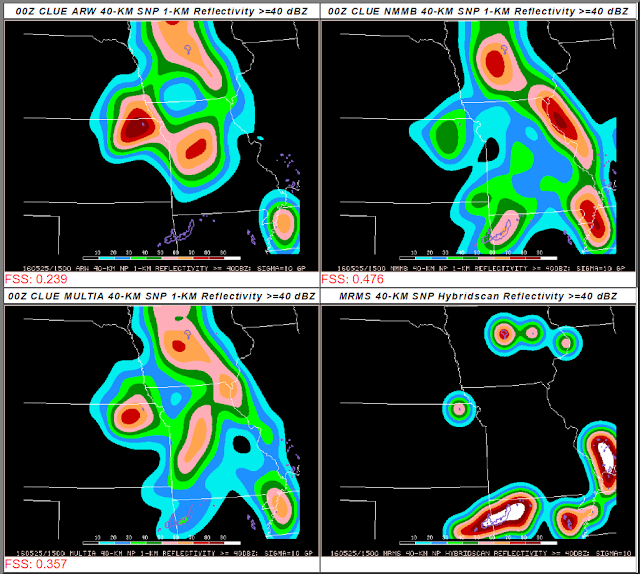
When evaluating the reflectivity forecasts, participants compare the probability fields from each ensemble displayed alongside "practically perfect" probabilities of reflectivity greater than 40 dBZ within 40 km of any given point. Underlying these probabilities are purple contours indicating the observed cores of reflectivity greater than 40 dBZ. Ideally, these purple contours would be within the envelope of probabilities generated using each ensemble. The probabilities would also ideally have a similar pattern as the practically perfect contours. However, expecting them to perfectly match isn't feasible. The neighborhood method probabilities for each ensemble indicate the confidence of the ensemble, whereas the practically perfect probabilities reflect more the coverage of the storms. However, we would expect them to be in similar locations and have the same general shape - if we have a squall line progressing across a state, we would want the ensemble probabilities to be oriented in roughly the same direction as the line of storms.
For the updraft helicity comparison, participants look at three separate fields: the ensemble maximum updraft helicity, the neighborhood probability of UH > 25m2/s2, and the probability of UH>100m2/s2. In the figure below, these fields are the columns, listed from left to right. Each subensemble is a row - the ARW ensemble is the top row, the NMMB ensemble is the middle row, and the mixed ARW/NMMB ensemble is the bottom row. Overlaid on each panel are the local storm reports, with tornadoes being symbolized as a red T, wind as a blue G or W, and hail as a green A. Square symbols indicate a significant severe report, with green for hail and blue for wind:
As UH is a proxy for severe weather, we want the reports to lie within the envelope of probabilities of UH, and near the tracks of UH. However, we've noticed that UH of 25m2/s2 is more indicative of any convection in these 3 km models, as UH is scale-dependent and increases as the resolution of the model decreases. Much of the previous UH work has used 4 km models, so we wouldn't expect the proxy values that worked in those studies (i.e., 25m2/s2) to work perfectly for the higher-resolution CLUE ensembles.
Finally, each day the participants learn how the ARW and the NMMB subensembles perform regarding the 3 h quantitative precipitation forecast (QPF) at four thresholds. Images over the prior day's domain are shown, as are the ROC areas at different forecast hours. For yesterday, the NMMB ensemble pinpointed the area of over .5" of precipitation (as indicated by the red area in the figure) better than the ARW ensemble at 15 hours:
 |
| Figure courtesy Eswar Iyer |
Since showing participants images for each threshold and each hour would take a prohibitively long time, ROC area graphics summarize the performance at four thresholds and 33 hours:
 |
| Figure courtesy Eswar Iyer |
If a forecast has a ROC area exceeding .7, it is considered a "useful" forecast. Yesterday, all of the models had trouble exceeding this value throughout the forecast, although at thresholds of .1 and .25, more hours than not exceeded the .7 criteria. Yesterday the NMMB performed slightly better than the ARW, as exemplified by the QPF forecast above. When looking at the reflectivity and UH, participants noted that the ARW did a particularly poor job on the reflectivity today. One participant said that although the northern Oklahoma UH was a bit overdone, it would have caught his eye. Since a storm did produce a number of reports in northern Oklahoma, including a tornado, this would have been a useful forecast for this participant.
Overall ratings for these subensembles ranged today from 2/10 to 7/10, depending on the field and the ensemble. The variety of responses from the participants shows how different participants view the forecasts, and the accompanying comments let us see why they rated the forecasts the way they did. In one forecaster's eyes, a single hour where one ensemble outperforms the others can be enough to give it a higher subjective rating. For others, a sustained period of slight improvement is enough. Integrating all of the fields over the run for each subensemble is a difficult task we've set to our participants, and each day they meet the challenge!


No comments:
Post a Comment