Yes, by Wednesday morning we already had two good examples of rapid forecast evolution. In the first example, we were able to refine and improve our forecasts from Day 2 (issued on Monday afternoon for Tuesday) to Day 1 (issued on Tuesday morning for Tuesday), as exemplified by comparing the forecasts for hail from Day 2:

and Day 1:

The objective metrics increase greatly from Day 2 to Day 1, as does the visual appearance of the forecast. The location and extent of the highest probabilities is much more accurate, and the increase in the magnitude of the probabilities comes closer to the magnitude of the practically perfect contours. The addition of a significant hail area (as encompassed by the blue hatched contour) also improved the forecast and more accurately depicted the threat. A similar trend occurred in the total severe probabilities, with a completely different orientation on Day 2 than the practically perfect contours:

While all of the reports were within the 5% contour on Day 2, the forecast does not represent the orientation or coerage of the reports well. However, the addition of convection-allowing guidance enabled a vast improvement of the forecast on Day 1:

With a consistent signal of several rounds of storms transitioning to what we thought was a training, heavy rain threat, the orientation of our highest probabilities across Kentucky was much easier to discern for the Day 1 forecast than for the Day 2 forecast. While the storms evolved into several rounds of cellular structures rather than a continuous line occurring over the same area, the reports coincided with our area of highest risk, and a great deal of low-risk area that did not produce reports was removed from the Day 2 forecast.
The second example of how quickly scenarios can change occurred overnight from 10 May 2016 to 11 May 2016, leading to a very complex forecast scenario for the 11th. Overnight, a complex of storms in Texas generated strong outflow that surged northward into Oklahoma at approximately 1 AM CST. The Oklahoma City North mesonet station captured the influence of this convection, which resulted in a dramatic drop in the dewpoints over the course of an hour.

Oklahoma City was quite far from this overnight convection, and the area between the city and the storms also saw a decrease in dewpoints. The lowered dewpoints affected the MLCAPE across most of Oklahoma and much of Texas, dramatically reducing the MLCAPE fields from the SPC's mesoanalysis between 0500 UTC (0000 CST):
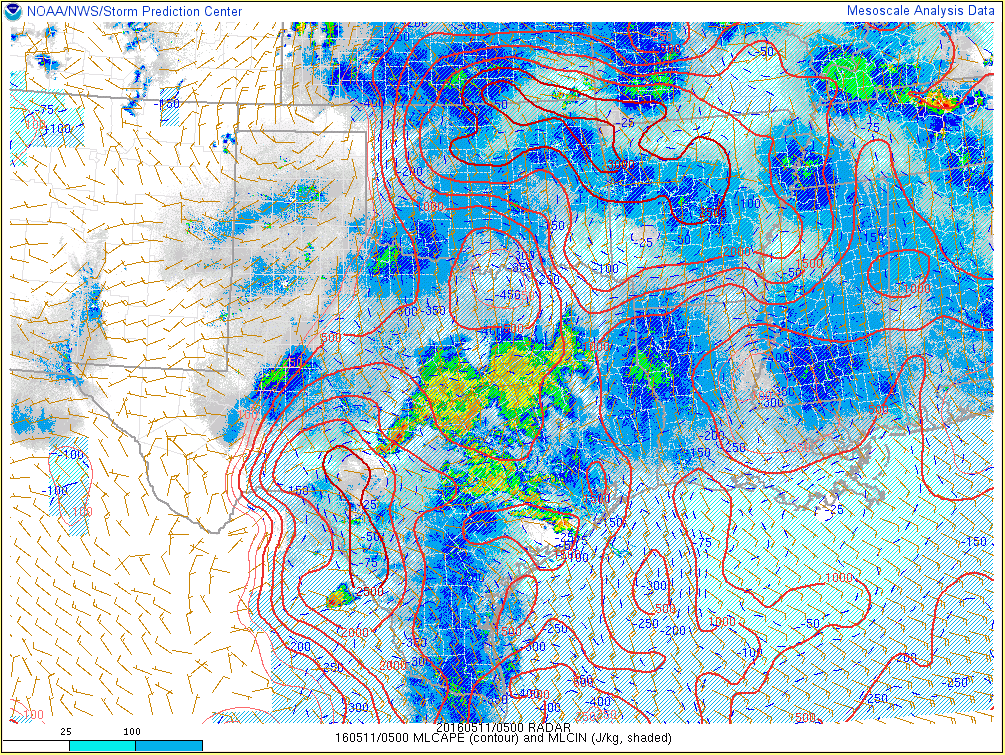
and 1200 UTC (0700 CST):

In the above figures, MLCAPE is represented by the red contours, and a great deal of central Texas and Oklahoma experience decreases in CAPE on the order of 1000J/kg. This type of mesoscale effect is far from uncommon, but occurs at a smaller and less-predictable scale than the broader, synoptic features. As a result, it's harder for the models to capture this sort of scenario. However, it ends up having a great deal of impact on the subsequent day's forecast. The atmosphere needs time to recover instability after the overturning that early or overnight convection can produce, resulting in a much different forecast with regards to timing, and perhaps even a different forecast of overall convective occurrence.
Indeed, the model guidance we used today was divided. Some of the models did not capture the morning convection, and maintained high dewpoints where in reality, they had been wiped out. So how do we handle these models? Do we completely throw out the rest of the run because of a bad initialization? Or can they still tell us something about the convective evolution at later times? Is the guidance that initializes the morning convection necessarily more accurate because of the lower dewpoints early in the period? Each forecaster has different opinions on how to handle these scenarios, which are all too common, and these questions have already generated much research. As for our forecasts for today, we considered all of the model guidance available, but made sure to take the models that missed the early convection with a grain of salt. We also compared them to models that did have the early convection, and when we saw agreement between these two camps, we felt more confident in our forecasts. The scenario today was a difficult one, and even our highest confidence was quite low.
The speed at which things have been changing this week is slightly dizzying. Verification tomorrow of this difficult forecast should prove telling, as we learn how important the mesoscale dewpoint drop was to the subsequent model forecasts. We'll also learn if we were lead astray by any of that guidance, or if our Day 1 forecast today improved upon our Day 2 forecast from Tuesday. Only time will tell!
No comments:
Post a Comment