Yesterday's area of forecast interest was the southeastern United States, corresponding with an upper-level trough and the warm sector ahead of the cold front. Since our first Day 2 forecast was issued for Tuesday, today (Wednesday) was the first day that we could evaluate a Day 2 forecast and see how we did. We also verified our Day 1 forecast for Tuesday. This forecast was a tricky one, as we weren't sure how much severe weather the line of convection would produce.
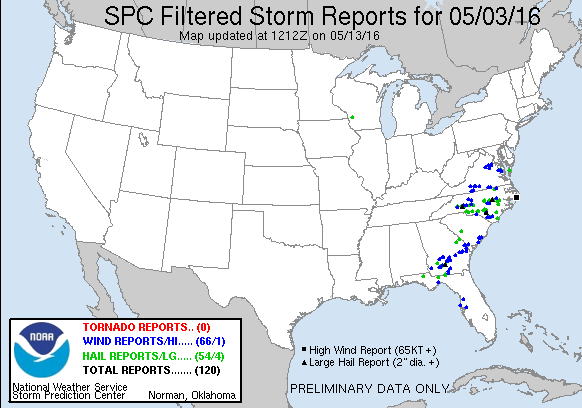
However, the day ended up being fairly productive, resulting in hail and wind reports from Virginia to the Florida Peninsula. If you consider the reports, you can see a gap in reports across the northern half of South Carolina. This gap was the cause of much discussion when issuing our forecasts yesterday.
Although some guidance was showing a gap in convective activity two days out, we were not confident enough in our forecasts to create a gap in our Day 2 outlooks. We also had less confidence in the event as a whole, resulting in a broadly brushed 10% contour for the full period total severe outlook, a broad 10% full period wind outlook, and a broad 5% hail outlook:

While the reports (hail in green, significant hail greater than 2" in dark green, and wind in blue) are useful when verifying these probabilistic forecasts, we can also use "practically perfect" forecasts. These forecasts show what probabilities would be forecast with prior knowledge of the report locations. For the total severe, wind, and hail outcomes on this day, the practically perfect forecasts have a broad swath of high probabilities for total severe, with a maximum in North Carolina. The wind reports generated two practically perfect areas, while the hail reports also had a maxima in North Carolina.

It's important to note that forecasters can issue more precise and accurate forecasts than the practically perfect forecasts: hence the "practically". However, our Day 2 forecasts were clearly not as good as the practically perfect probabilities, because we didn't have high confidence in this event at that time.
On Day 1, we had a much larger suite of convective guidance and issued two probability maxima at the total severe desk, as well as two probability maxima for wind and one probability maxima for hail at the individual hazards desk.

The magnitude of these contours matched much better with the magnitudes in the practically perfect than our Day 2 magnitudes. As part of the experiment, we are able to issue contours that do not match the practically perfect values, such as 10%, 20%, and 25%. While the magnitudes of our forecasts were not quite as high as the maximums in the practically perfect, they were better able to discern that two separate risk areas would occur. Since most of the convection-allowing guidance was at small enough scales to portray finer areas of risk than coarser guidance, we were able to improve our forecast.
What can we learn from this event? 1. Forecasting backbuilding of storms or multiple rounds of storms isn't easy - see the reports occurring outside of the total severe team's probabilities. 2. We can learn from previous days' forecasts. When we verified the Monday forecasts on Tuesday, we noted the hail production of Monday's storms. The cold temperatures aloft were still occurring with this system, and the hail forecasts were much higher in our Day 1 outlooks (Tuesday) than Day 2 outlooks (Monday), joining wind as the most probable threat. 3. Convection-allowing guidance can provide clues as to finer-scale details of events, such as the gap over northern South Carolina.
No comments:
Post a Comment